Chart Generator Tool in a Single-Node Agent
Step- 1: Choose a blank canvas to customize for defining the user's own agent behavior.
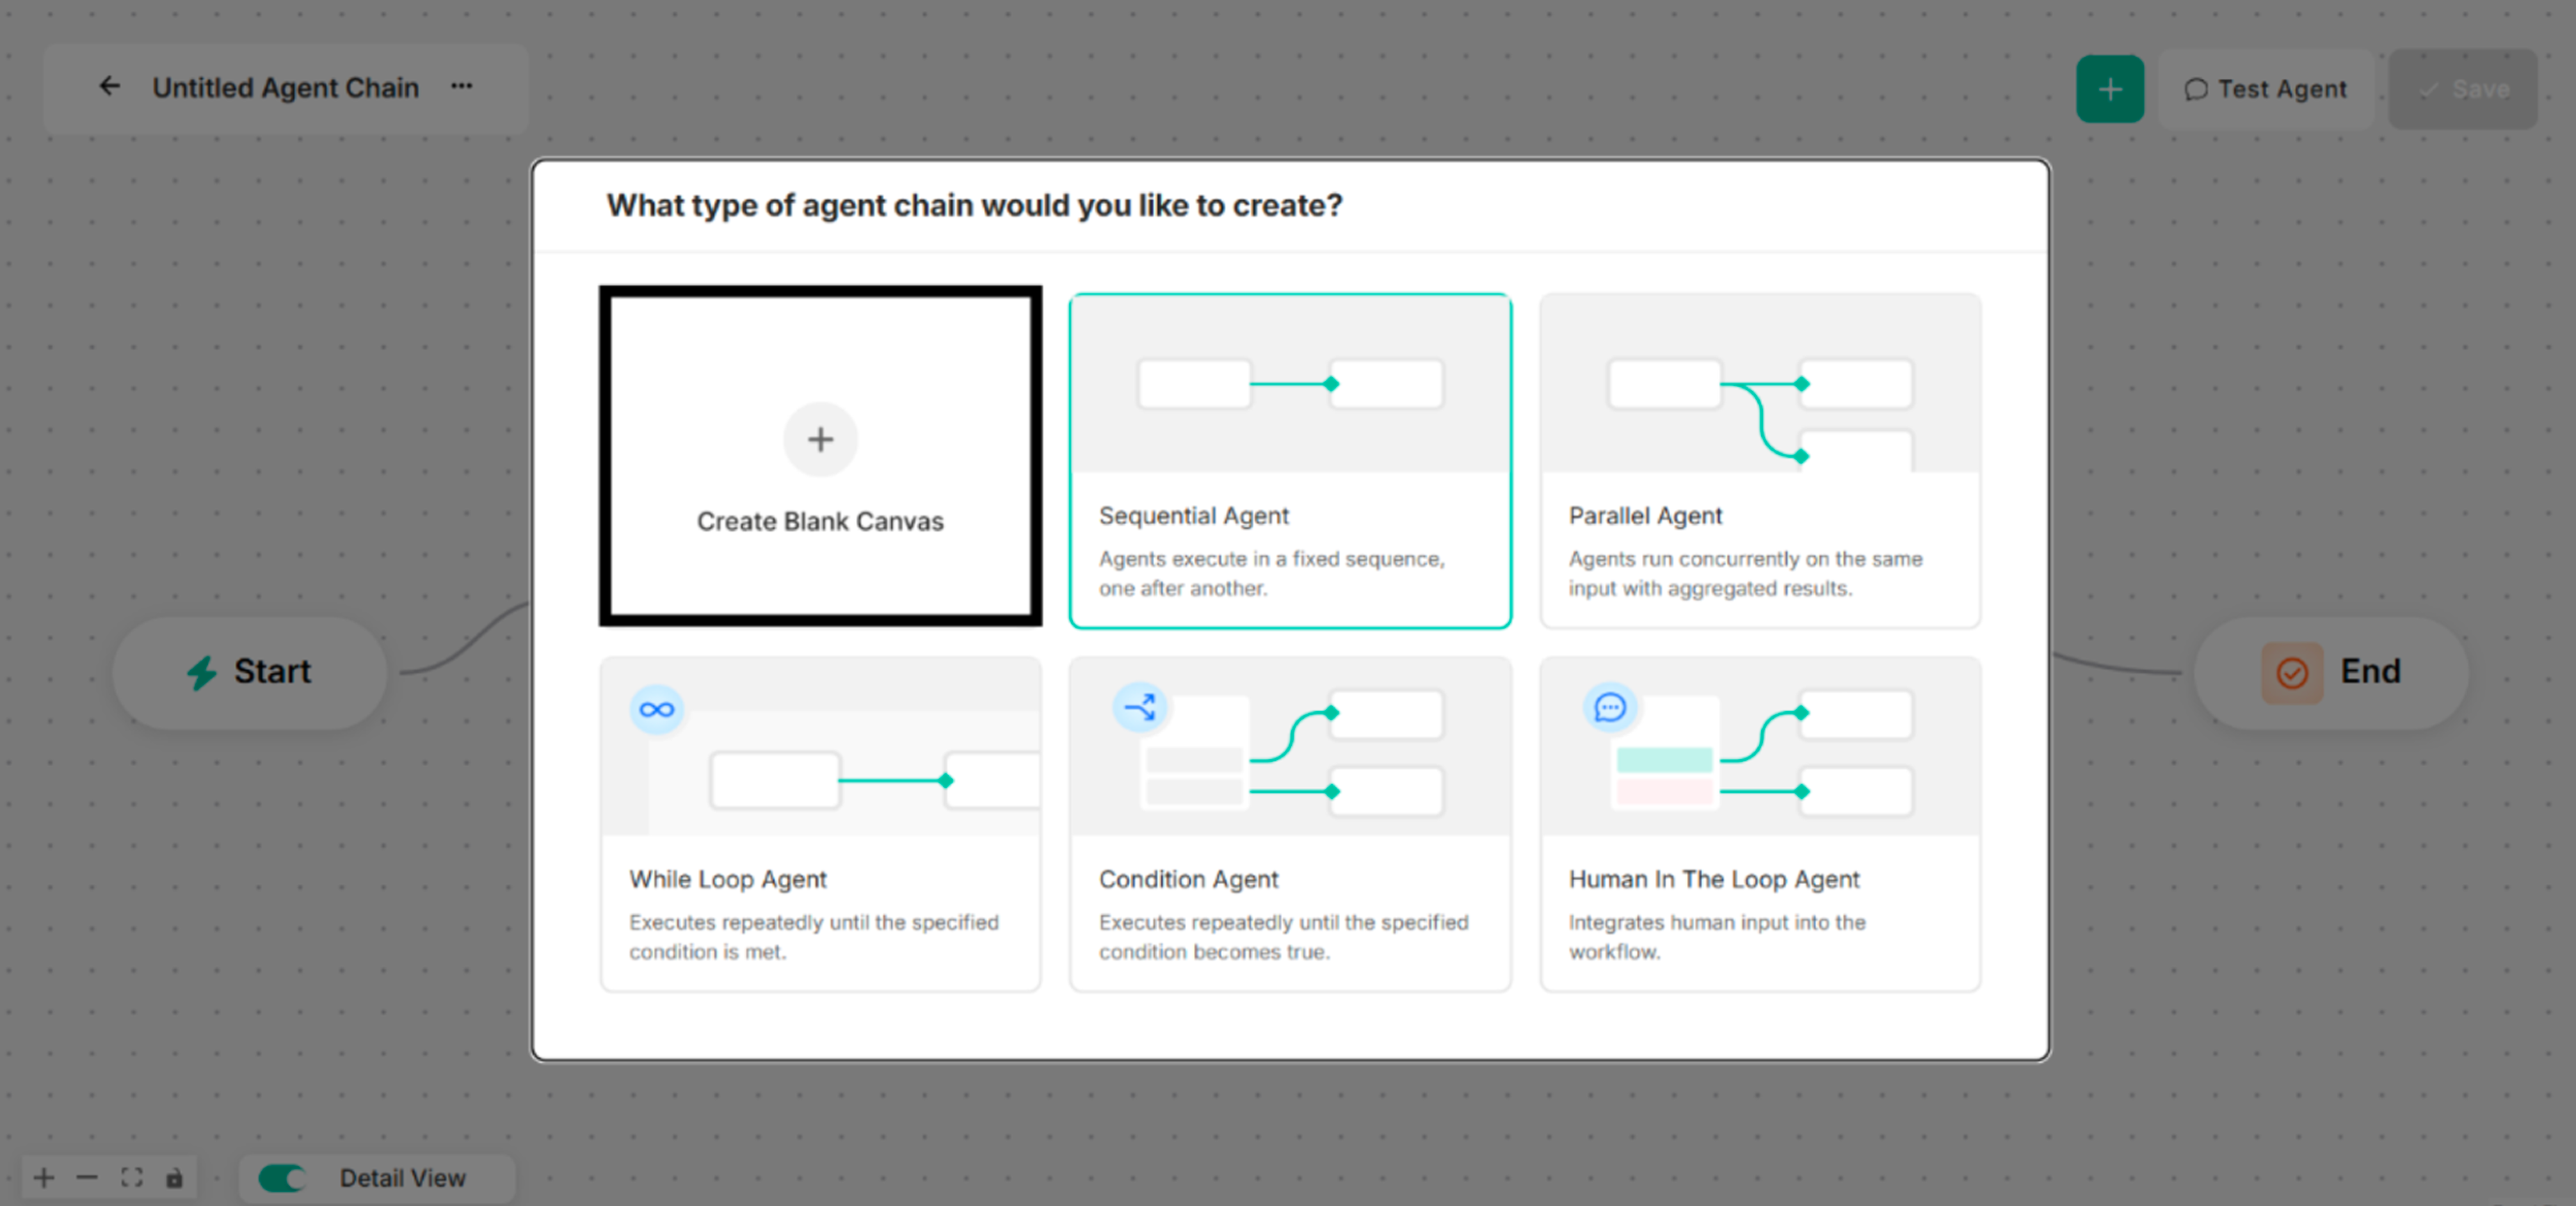 Figure: Interface showing Blank Canvas for a Single-Node Agent Creation
Step- 2: Choose Chart Generator for the selected type of agent chain to create. The Agent Name and Model Name are renamed before Chart Generator is chosen.
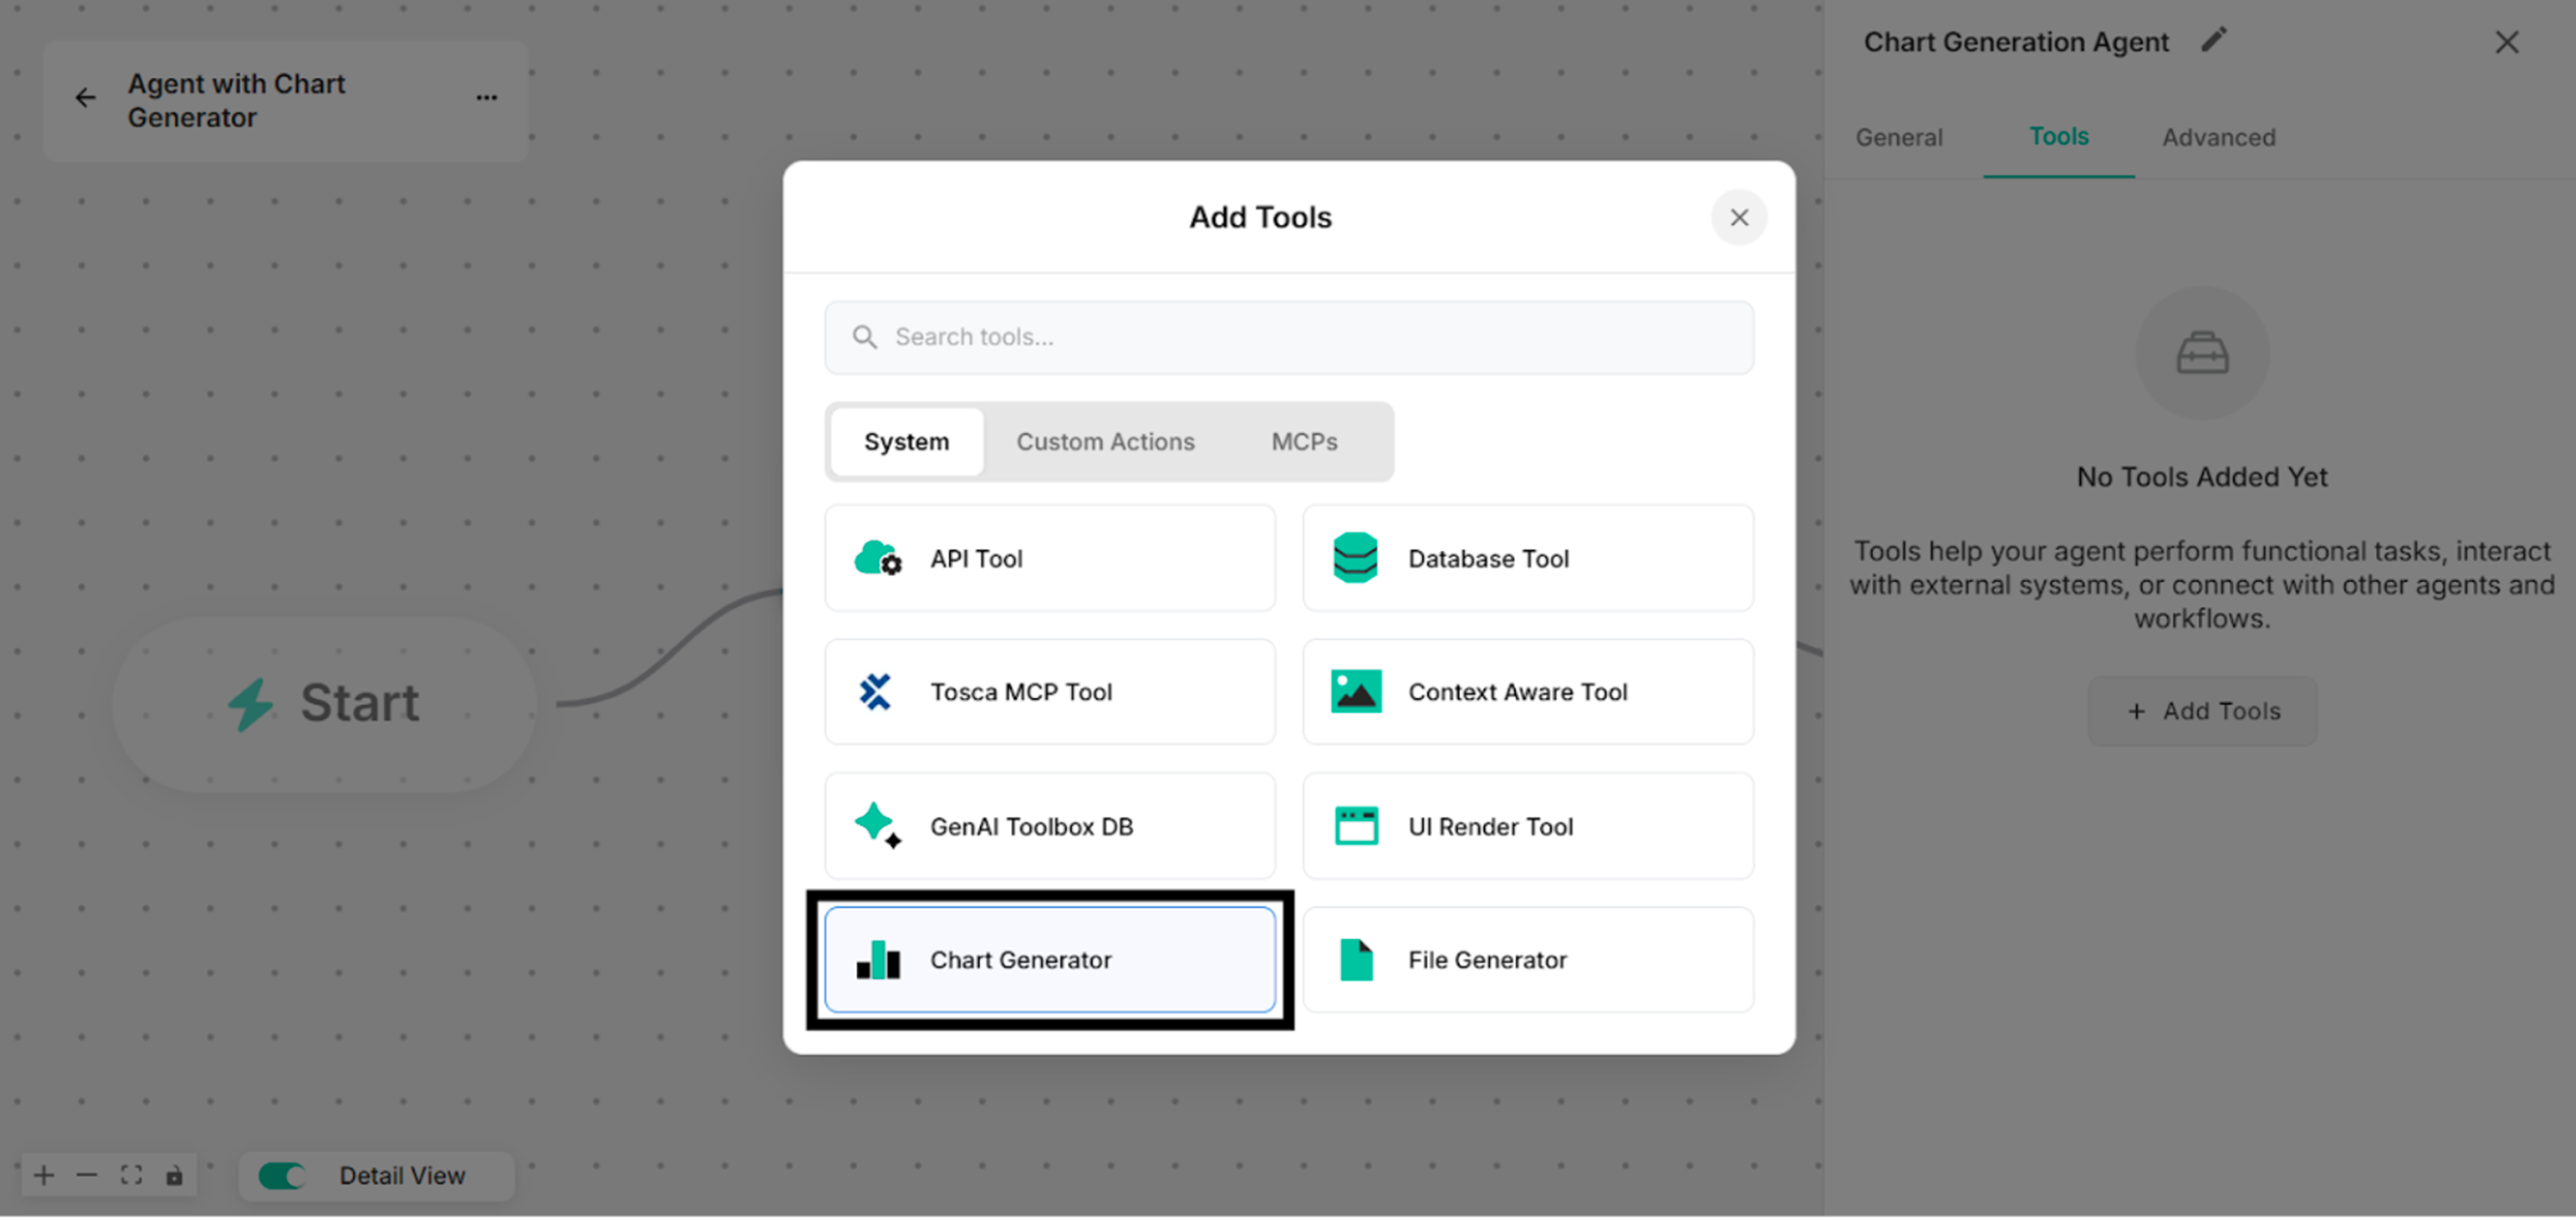 Figure: Showing to select Chart Generator in Add Tools List
Step- 3: By clicking Manage button, rename the tool name for the Untitled Tool.
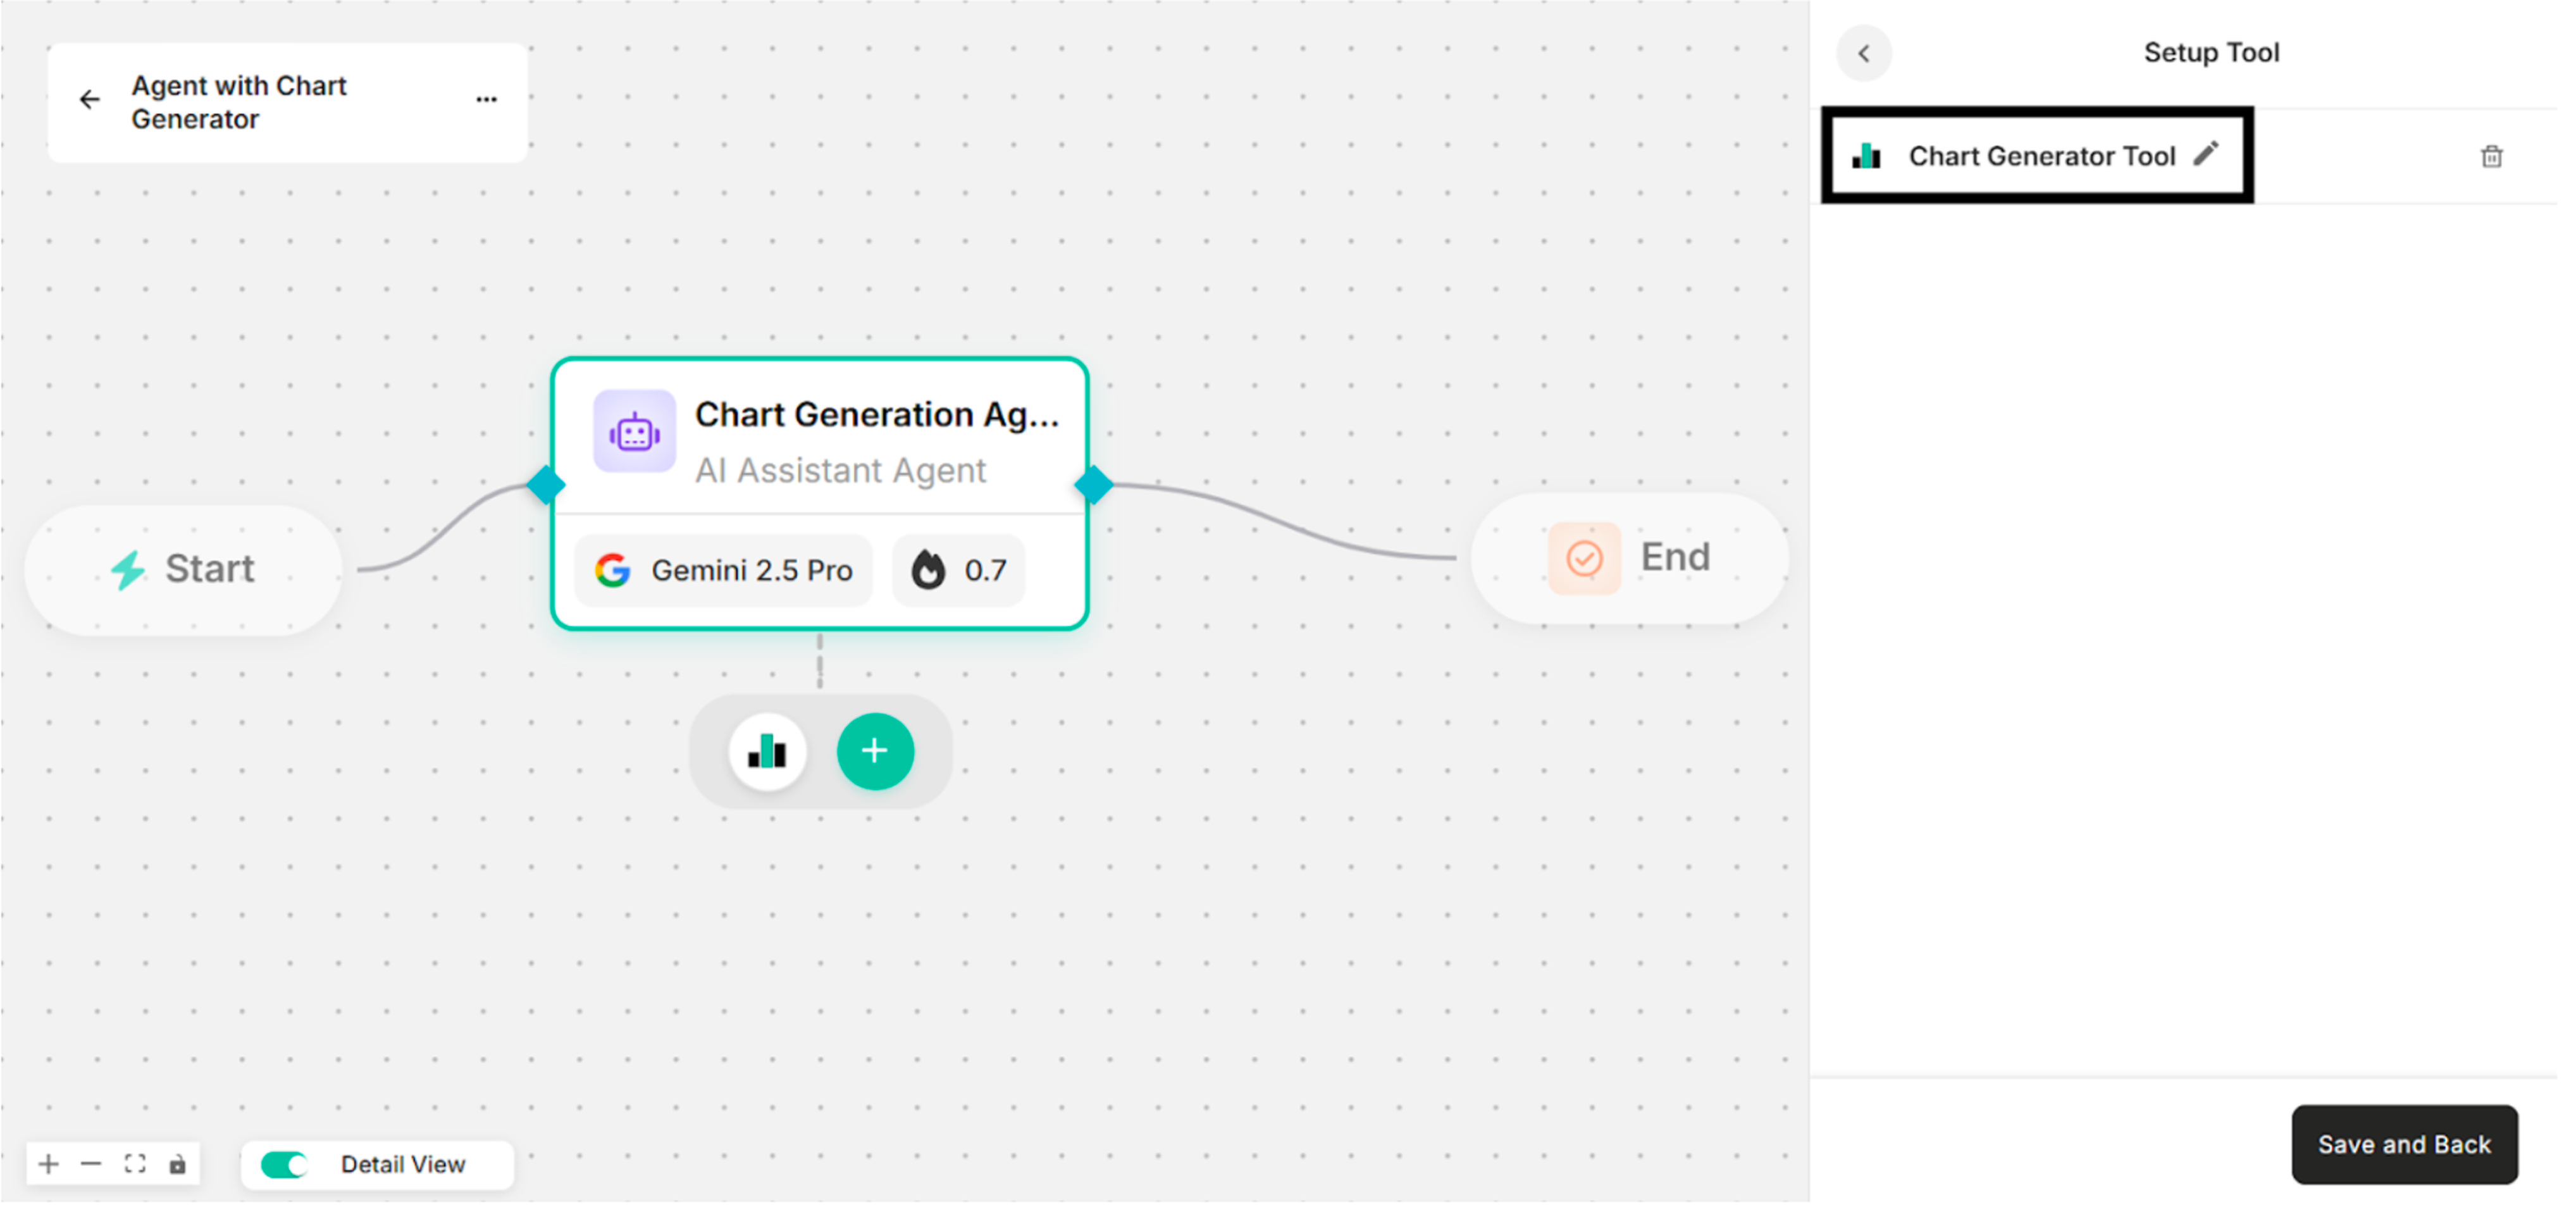 Figure: Showing the Renamed Tool Name that has been renamed in Setup Tool Interface
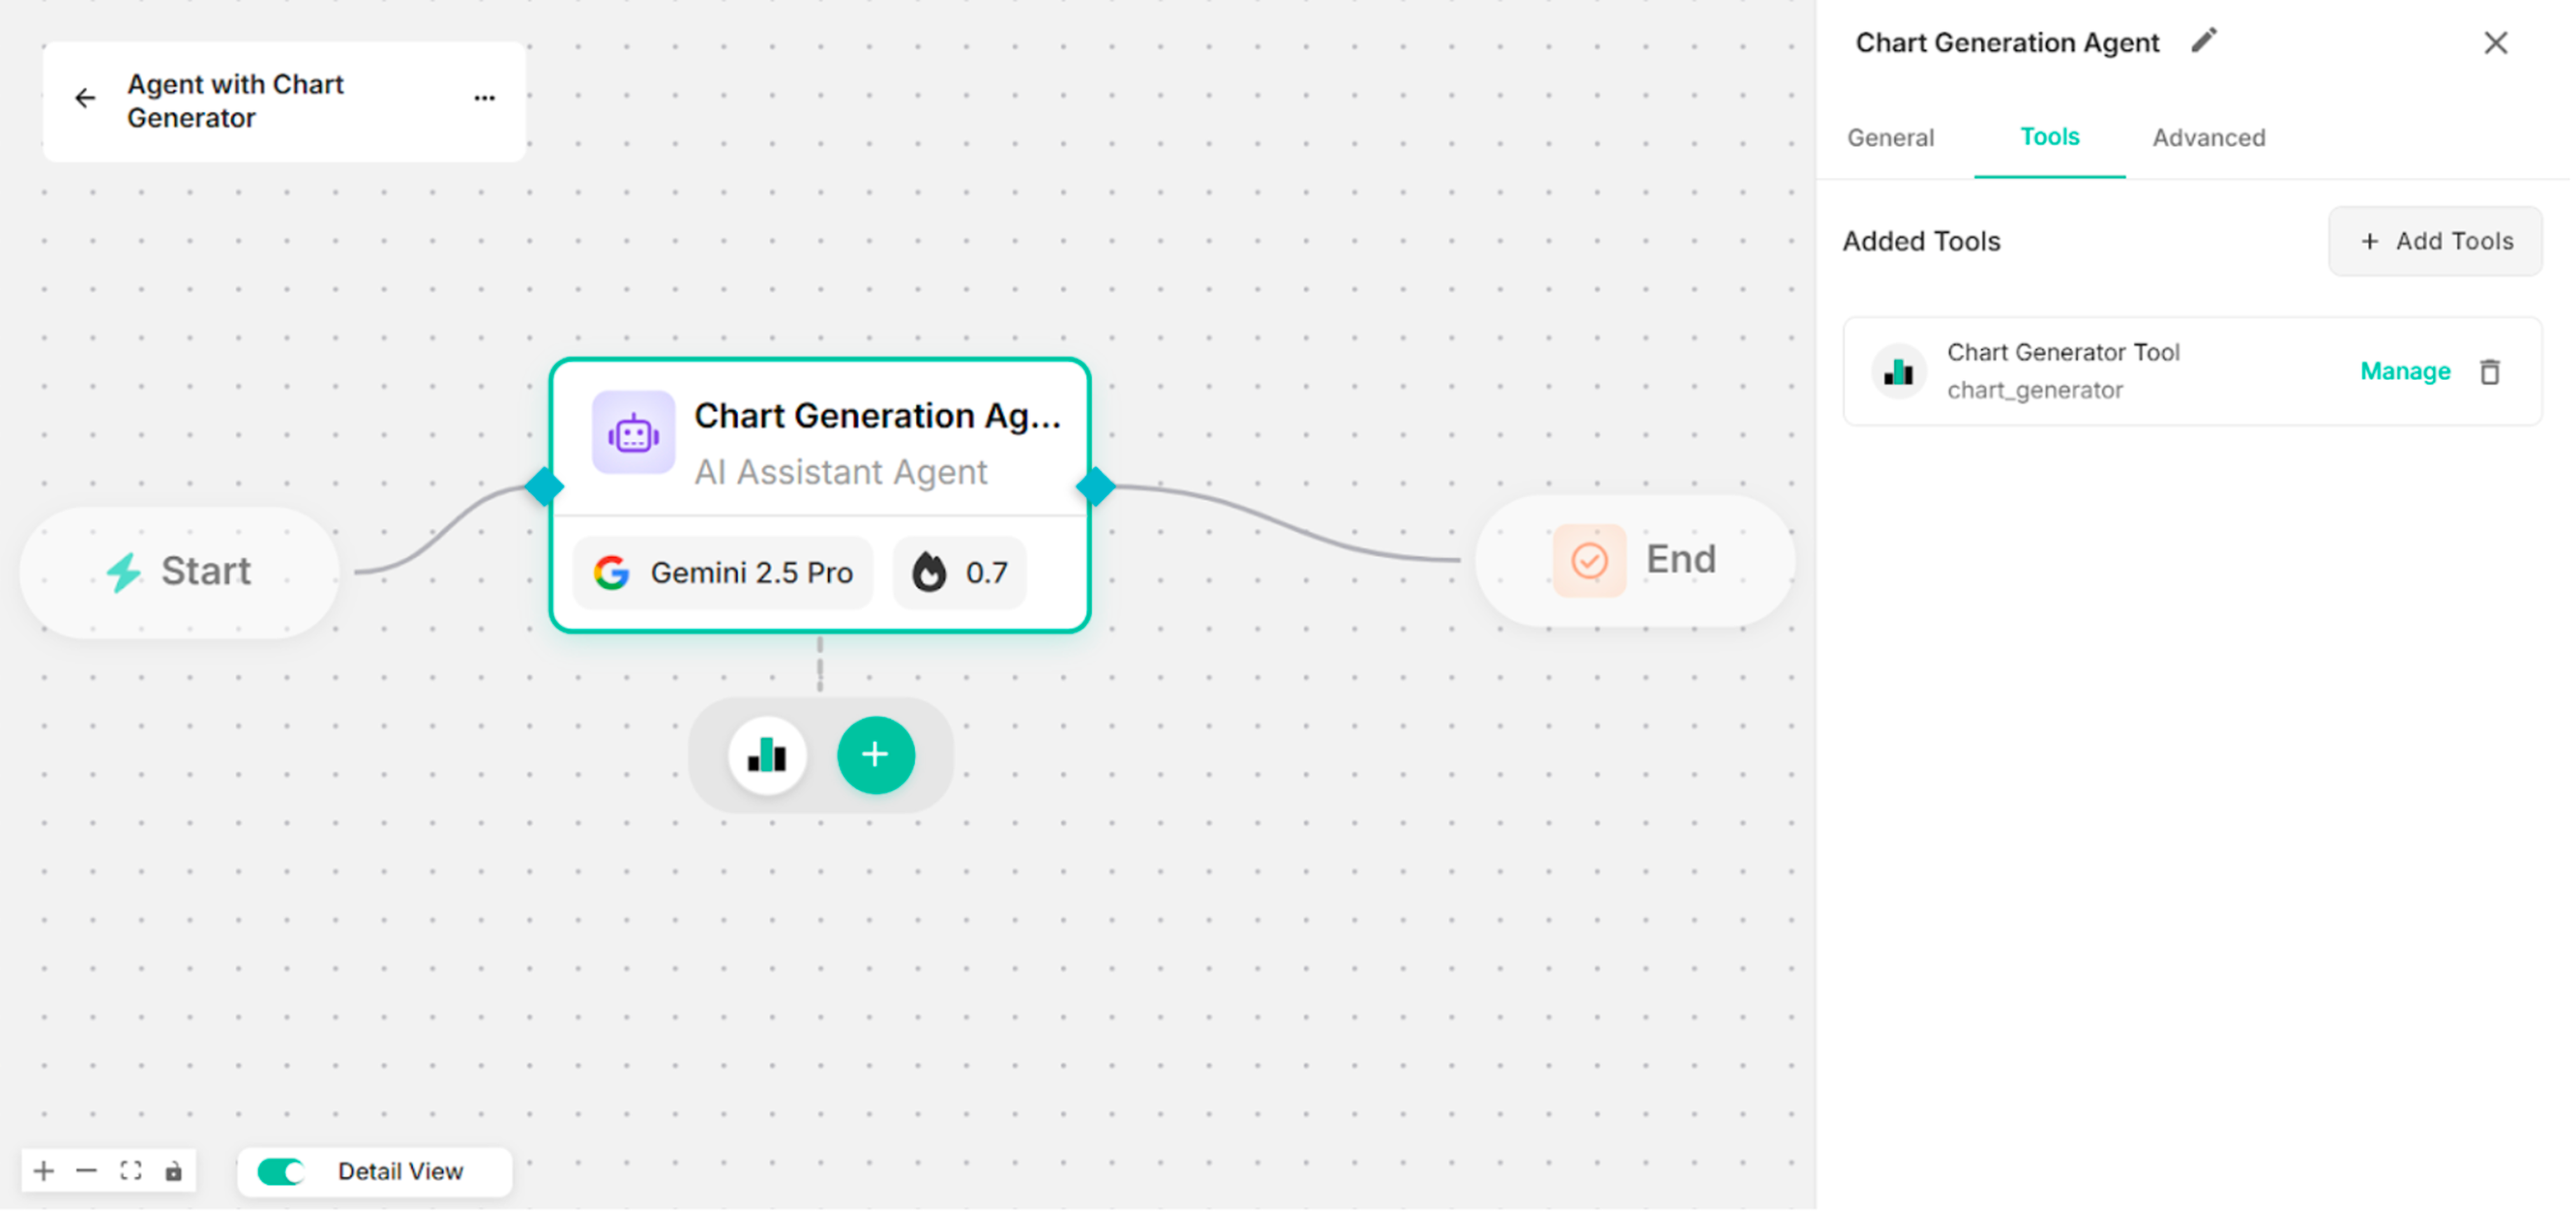 Figure: Showing the Canvas with the Created Chart Generator Tool
Step- 4: Enter instruction in the Instruction box to use the created Chart Generator tool.
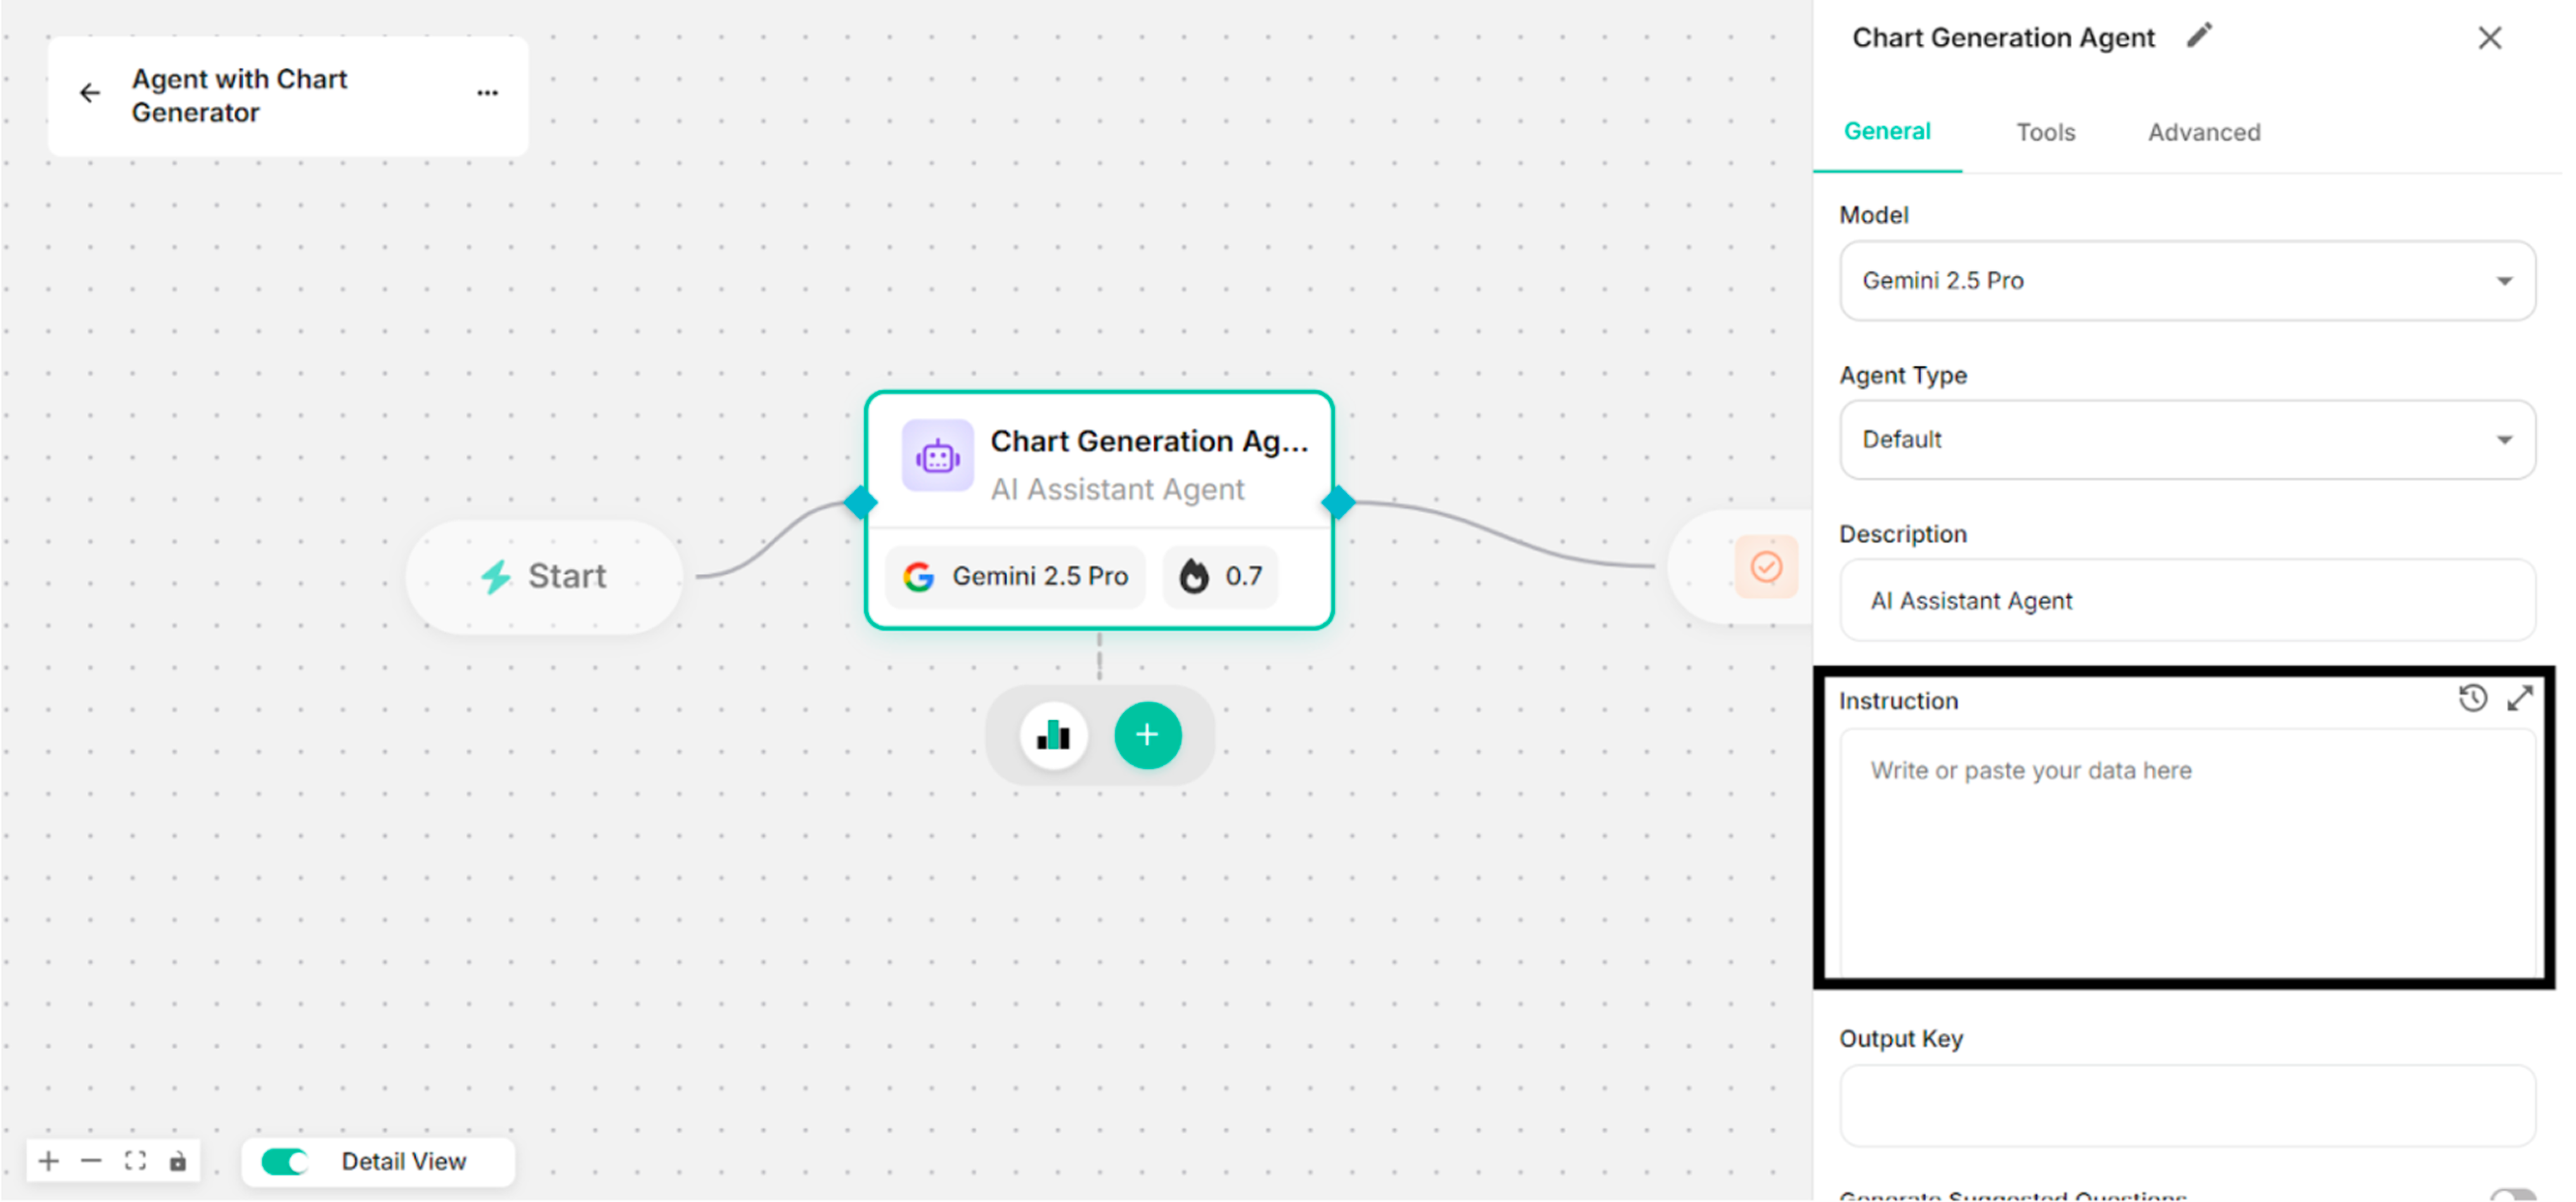 Figure: Showing to add Instruction in the Instruction Box
Step- 5: Click Save button with the created Chart Generator tool.
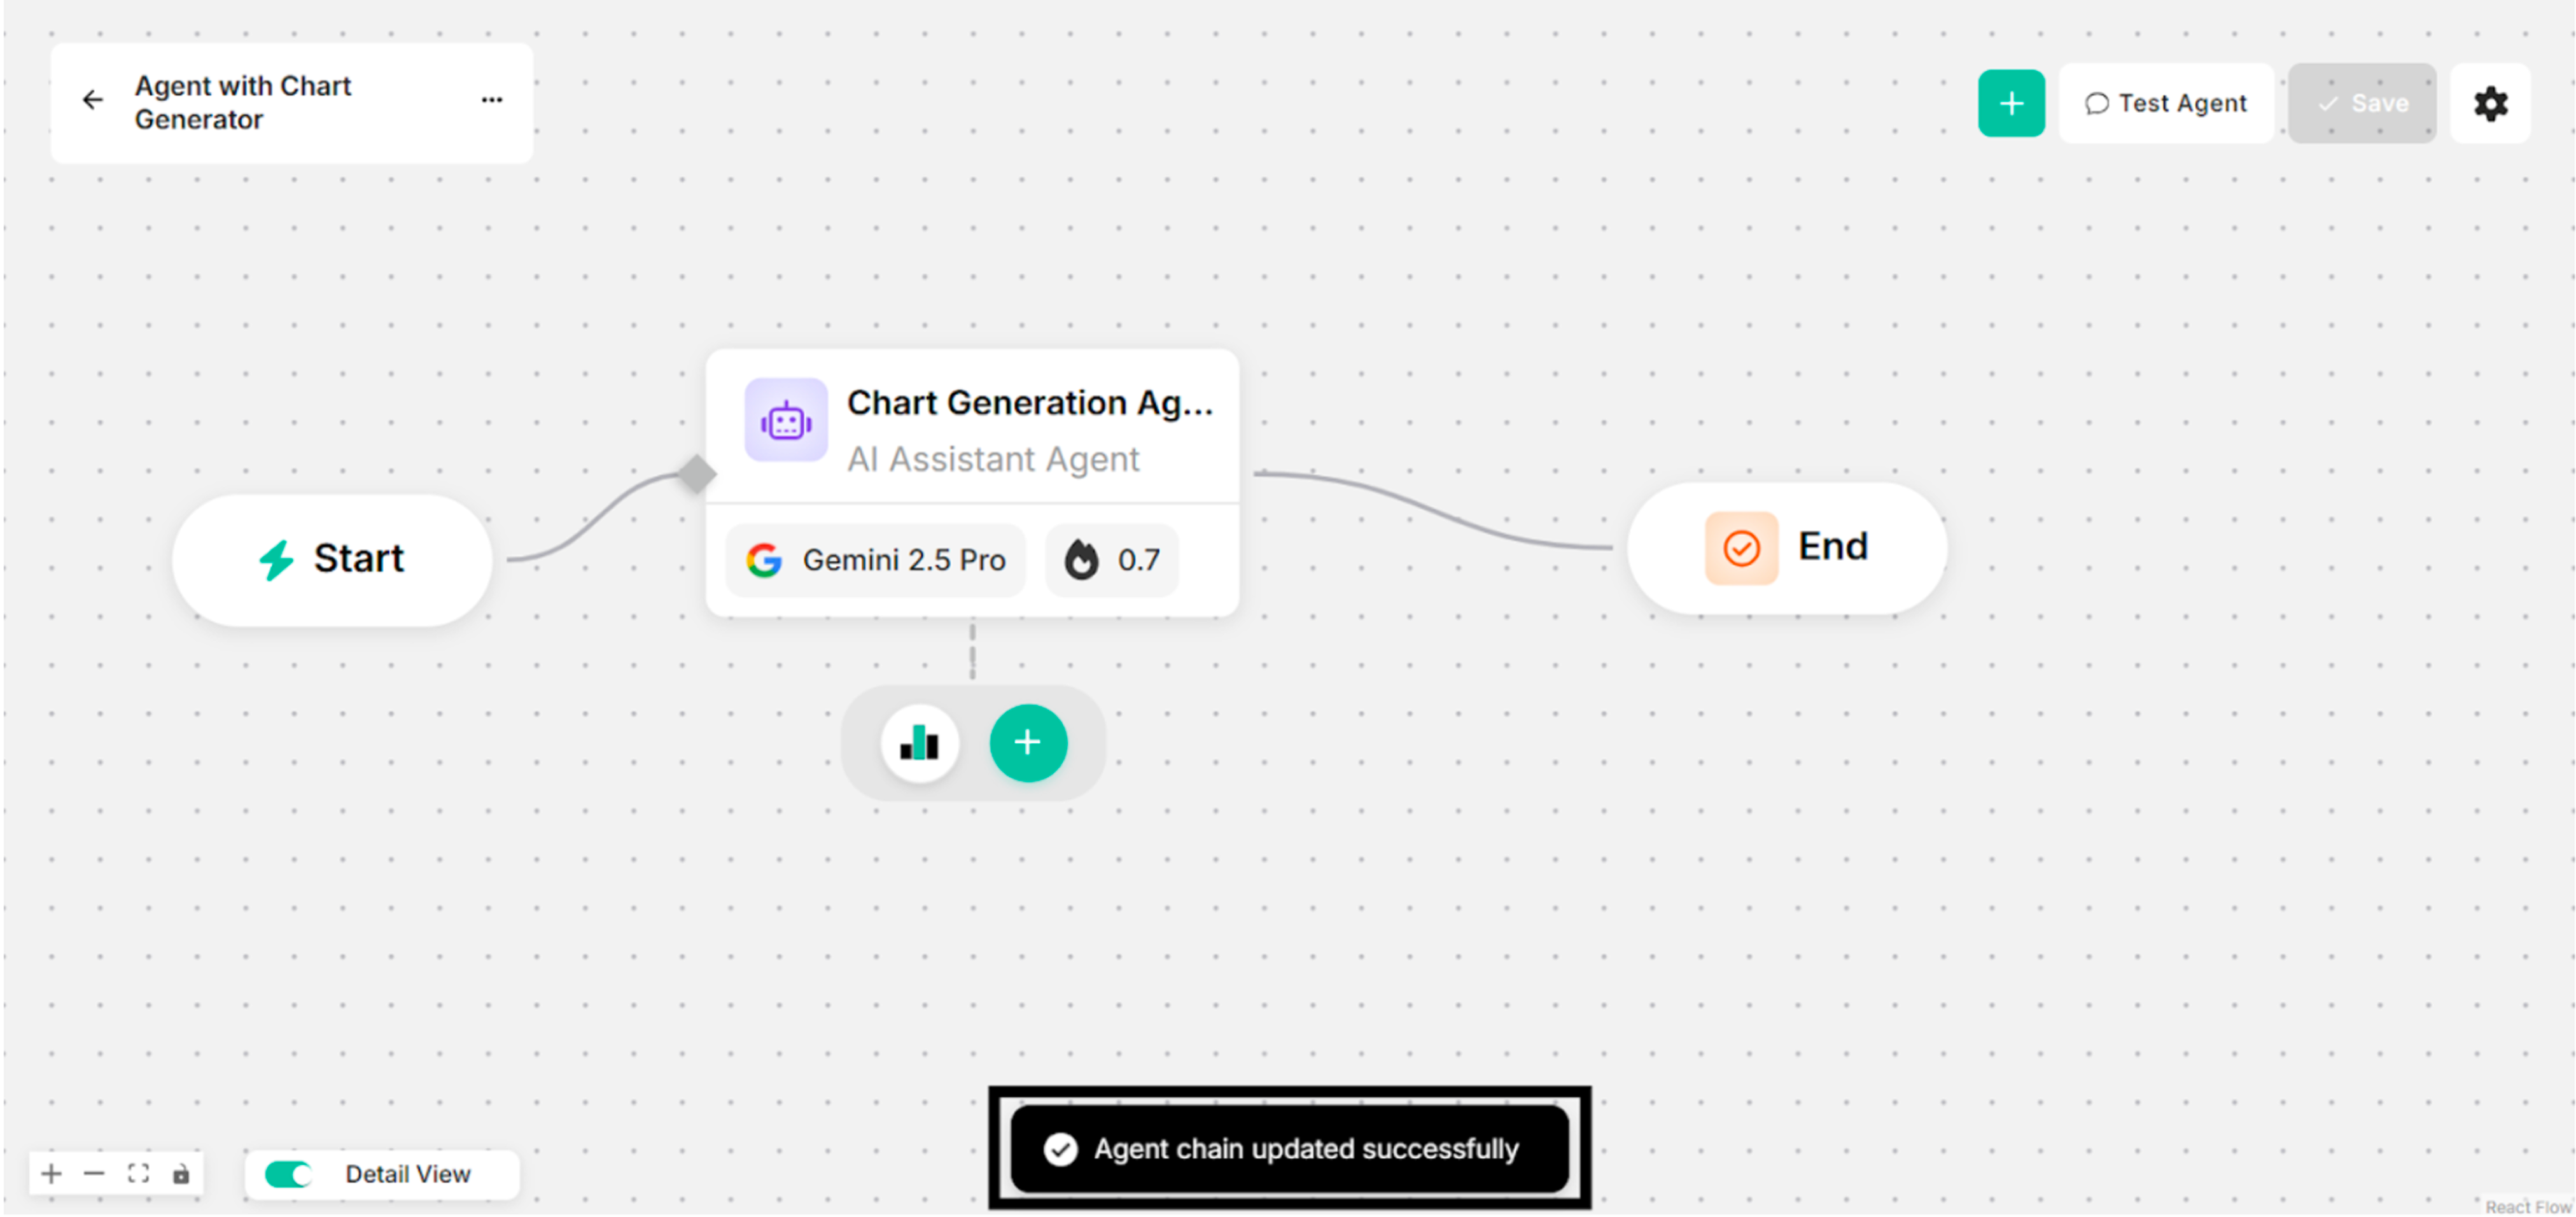 Figure: Showing Success Message with Chart Generator Tool for Clicking Save Button
Step- 6: Ask some questions with the successfully created Chart Generator tool.
-a72956b11392b5c9c6f8a212ee41163a.png) Figure: Showing Some Questions and Answers with the Requested Charts in Canvas (with Chart Generator Tool)
Figure: Showing Some Questions and Answers with the Requested Charts in Canvas (with Chart Generator Tool)